Integrating with Dynatrace
This section describes how to integrate WebLOAD with Dynatrace.
Dynatrace is a suite of Application Performance Monitoring (APM) tools that enables in-depth real-time application monitoring.
By integrating WebLOAD scripts with Dynatrace you can rapidly resolve and proactively prevent application performance problems. The integration consists of two tasks:
- Installing Dynatrace on your local computer.
- In WebLOAD – Enabling Dynatrace in the Dynatrace tab of the Global Options window. When Dynatrace is enabled, WebLOAD adds an identifier in all request headers which identifies them as WebLOAD requests.
You can also enable the integration from the script itself, instead of from the Dynatrace tab, by adding the following line to the JavaScript code of the script:
When the integration is enabled, WebLOAD adds an x-dynaTrace header to every request of the script:
x-dynaTrace: NA=<transaction or page name>;SN=<script name>;VU=<virtual client number>;PC=<page context>
NA is the name of the transaction that the request belongs to, or the page name when the request is not part of a transaction. SN (Script Name) groups together all the requests of one script; in a load session it is reported as <agenda name>@<load generator name>. VU is the number of the virtual client that sent the request, and PC is the page context.
Note: In WebLOAD 13.4 and earlier, requests sent by playback inside the WebLOAD IDE carry an internal engine name in the
SNfield instead of the script name. Requests sent by virtual clients in a load session are not affected. This is corrected in WebLOAD 14.0.0.317 and later.
After integrating WebLOAD with Dynatrace, you can perform the following:
- Integrating with Dynatrace
- Monitoring a WebLOAD Load Session in Dynatrace
- Viewing in Dynatrace a WebLOAD Point of Interest
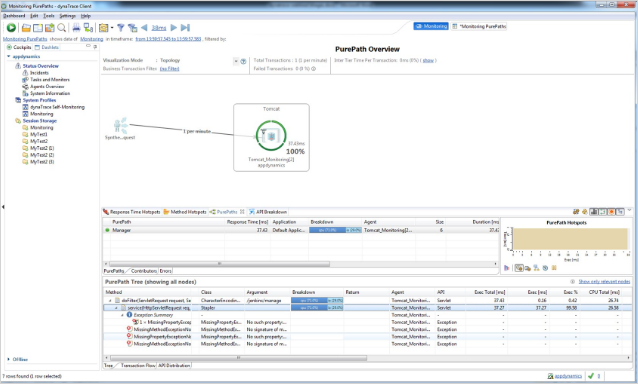
- Viewing in Dynatrace the Transactions Related to WebLOAD Errors
Monitoring a WebLOAD Load Session in Dynatrace
To monitor a WebLOAD Load Session in Dynatrace:
- Enable Dynatrace in The Dynatrace Tab .
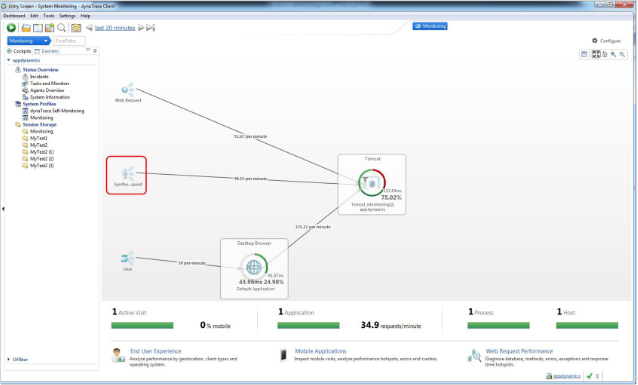
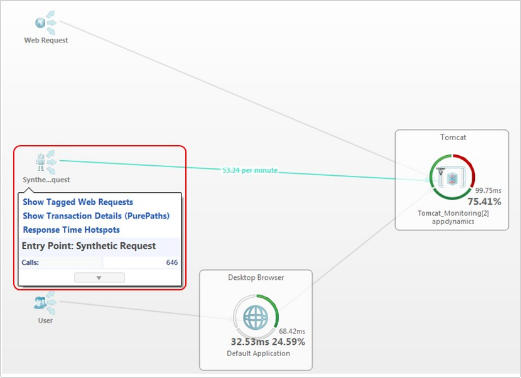
- In the Dynatrace Monitoring page, click the Synthetic Request node.
A dropdown list of options appears, enabling you to access the various monitoring and drill-down options offered by Dynatrace.
Viewing in Dynatrace a WebLOAD Point of Interest
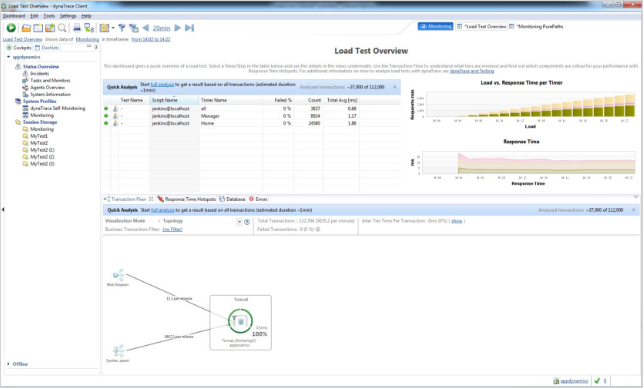
You can access Dynatrace directly from a WebLOAD’s report window to view in Dynatrace the monitoring data of any point in a WebLOAD graph.
To view Dynatrace data for a WebLOAD point of interest:
- Enable Dynatrace in The Dynatrace Tab .
- In a WebLOAD report, right-click a point in a graph and select DynaTrace.
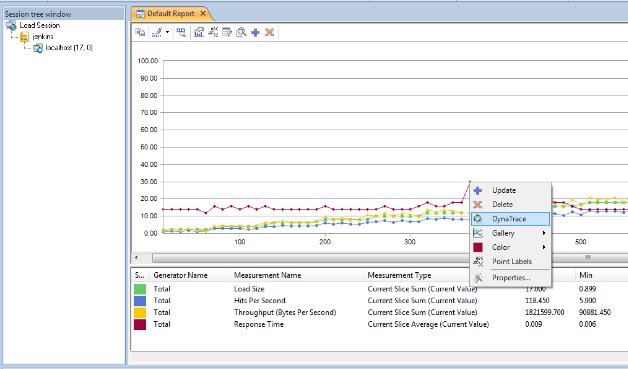
- A Dynatrace window appears, showing data for the time period starting from 10 minutes prior to the point of interest, and ending 10 minutes after the point of interest.
Specifying the Dynatrace System Profile
When you enable Dynatrace in WebLOAD (refer to The Dynatrace Tab , by default WebLOAD specifies that points of interest viewed in Dynatrace will be viewed in the Monitoring system profile. If you wish to change this default setting, do the following:
-
Click Global Options in the Tools tab of the ribbon,
-Or-
Select Global Options from the Console System button.
-
Select the Dynatrace tab.
-
In the Timestamp field, change:
rest/integration/opendashboard?source=live:Monitoring&filter= tf:CustomTimeframe?To:
rest/integration/opendashboard?source=live:<Your-desired- system-profile>&filter=tf:CustomTimeframe?
Whenever you click a point of interest in WebLOAD and select DynaTrace, the point of interest will be displayed in the Dynatrace system profile you specified in the Timestamp field.
Viewing in Dynatrace the Transactions Related to WebLOAD Errors
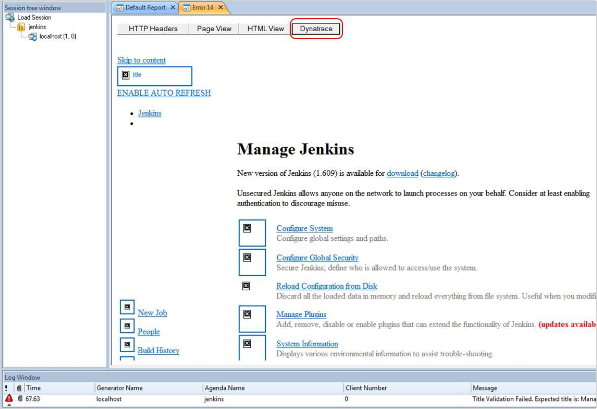
If an error occurs at any time during a test session, an error message displays in the Log Window. If you installed Dynatrace, you can access Dynatrace directly from WebLOAD’s Log Window to view in Dynatrace the transaction associated with the error.
To view a transaction in Dynatrace that is associated with a WebLOAD error:
-
Enable Dynatrace in The Dynatrace Tab .
-
In the Log Window, double-click the paperclip icon adjacent to the error.

-
In the Event Viewer that appears, click the Dynatrace button
-
A Dynatrace window appears, displaying the details of the relevant transaction.